Last Updated on September 22, 2023 by Mayank Dham

We will see a flow chart example. A flowchart is simply a graphical representation of a series of actions. It is commonly employed to illustrate the progression of algorithms, workflows, or procedures, as it presents the steps in a linear order. Typically, a flowchart portrays these actions as distinct boxes of varying types, connected by arrows that indicate their sequence.

What is a Flowchart?
A flowchart is a diagram that shows how a process works. Although it started out as a tool for describing algorithms and programming logic in computer science, it has since expanded to be used in all different sorts of operations. These days, flowcharts are crucial for displaying information and supporting arguments. They aid in the visualization of complex processes or make the structure of issues and activities clear. A flowchart can also be used to outline a project or procedure that has to be put into action.
Flowchart Symbols
Various flowchart shapes correspond to various customary meanings. The following are some of the more popular forms’ meanings:
Terminator
The system’s beginning or end is represented by the terminator symbol.

Process
A box denotes a specific procedure.

Document
This is an image of a printed item, like a report or a paper.

Decision
A choice or branching point is represented by a diamond. The diamond’s lines represent many scenarios that could occur and result in various sub-processes.

Data
Represents data coming into or going out of the system. An example of an input is a customer order. A product to be provided can be the output.

On-Page Reference
There would be a letter inside of this sign. It denotes that the flow will resume on another matching symbol with the same letter on the same page.

Off-Page Reference
There would be a letter inside of this sign. It indicates that the flow will continue on a separate page with a matching symbol that contains the same letter.

Delay or Bottleneck
Shows when there is a lag or a bottleneck.

Flow
The direction and flow of a process are shown as lines.

When to Draw Flowchart?
A flowchart can be useful for several reasons, including
- It makes complicated procedures clearer.
- It highlights actions that do not benefit the internal or external customer, such as delays, wasteful transportation and storage, extra work and costs, duplication of effort, and communication breakdowns.
- It aids in team members developing a common understanding of the procedure, which they can then use to gather information, spot issues, direct conversations, and locate resources.
- It provides a framework for creating new procedures.
Flowchart Examples
Here are a few examples of flowcharts. Examine the practical applications of a flowchart.
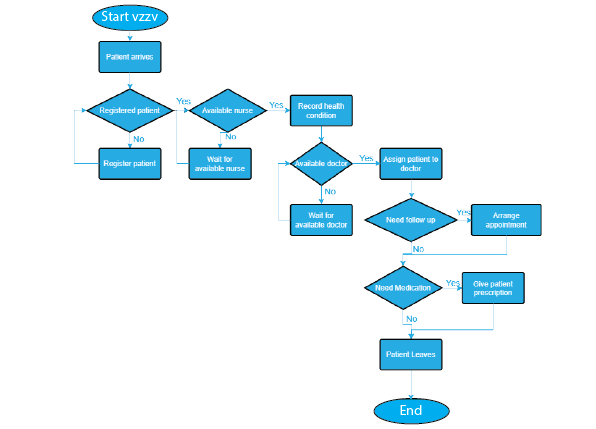
Flowchart Example – Medical Service
This is an illustration of a hospital flowchart that demonstrates how clinical cases should be handled. Decision shapes are heavily used in this flowchart to illustrate different flows.
Flowchart Example – Simple Algorithms
Regardless of how complex an algorithm is, a flowchart can be utilized to visualize it. Here is an illustration of how a flowchart can be used to illustrate a straightforward summarization procedure.

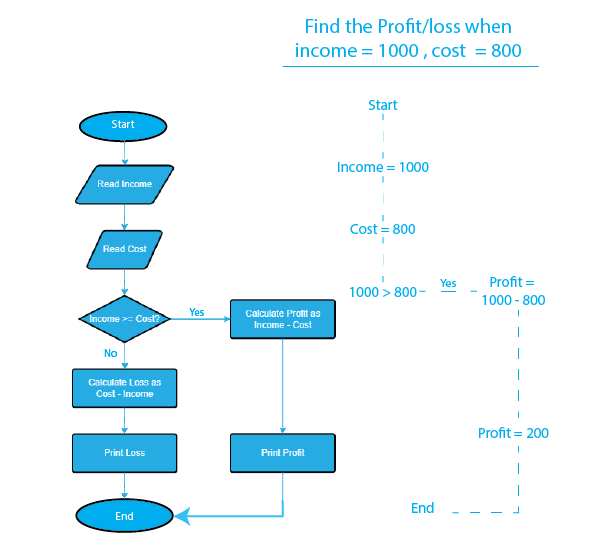
Flowchart Example – Calculate Profit and Loss
The calculation of profit and loss can be seen in the example flowchart below.
Creating a Flowchart in Visual Paradigm
Let’s examine the Visual Paradigm flowchart drawing tutorial. Here, we’ll utilise a rather basic flowchart example. Once you’ve finished the instruction, you can expand the sample.
- Select Diagram > New from the main menu.
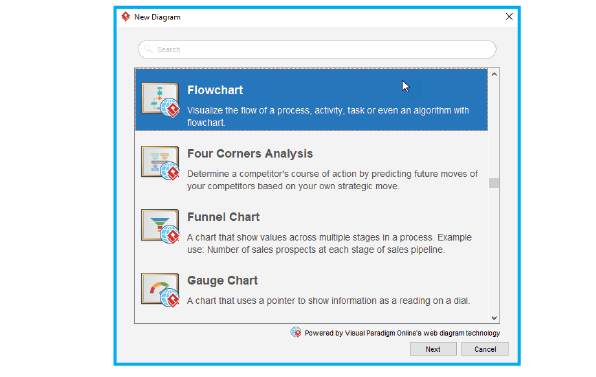
- In the New Diagram window, select Flowchart and click Next.
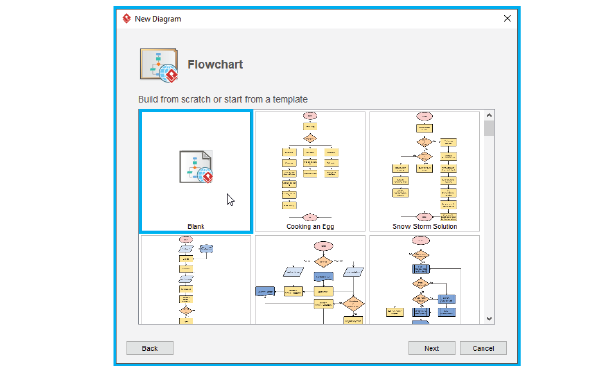
- You can start from an empty diagram or start from a flowchart template or flowchart example provided. Let’s start from a blank diagram. Select Blank and click Next.
- Enter the name of the flowchart and click OK.
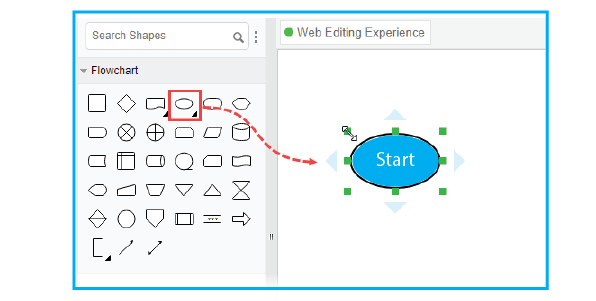
- Let’s start by creating a Start symbol. Drag the Start shape from the diagram toolbar and drop it onto the diagram. Name it Start.
- Create the next shape. Move your mouse pointer over the start shape. Press on the triangular handler on the right and drag it out.

- Release the mouse button. Select Flow Line > Process from the Resource Catalog.
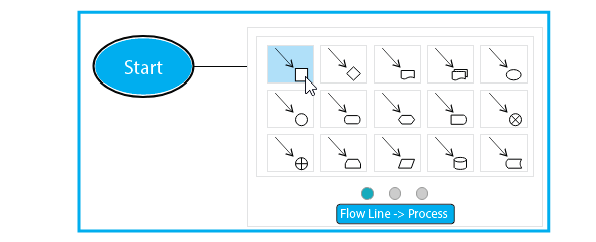
- Enter Add items to Cart as the name of the process.
- Follow the same steps to create two more processes Checkout Shopping Cart and Settle Payment.

- End the flow by creating a terminator.

Your diagram should look like this:

- Color the shapes. Select Diagram > Format Panel from the main menu. Select a shape on the diagram and click update its color through the Style setting in the Format Panel.
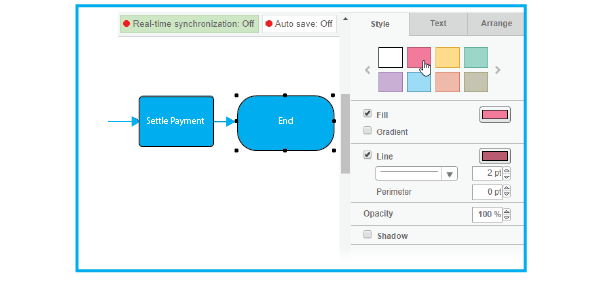
This is the final flowchart:

Conclusion:
Designing flowcharts in programming is a crucial step to visually represent algorithms, logic, and processes. A well-designed flowchart simplifies complex programming concepts, aids in debugging, and enhances communication among developers. By following established conventions and principles, programmers can create effective flowcharts that streamline code development and improve overall program understanding.
Frequently Asked Questions (FAQs) related to How to Design Flowcharts in Programming:
FAQs related to How to Design Flowcharts in Programming are given below:
1. Why is designing flowcharts important in programming?
Designing flowcharts helps programmers visualize the logical flow of a program, making it easier to understand, analyze, and debug complex code.
2. What are the basic symbols used in flowchart design?
Flowcharts use symbols like start/end symbols, process boxes, decision diamonds, connectors, and input/output symbols to represent different elements of a program.
3. How do I start designing a flowchart?
Begin with a start symbol, followed by process boxes, decision diamonds, and connectors to illustrate the sequence of actions and decisions in your program.
4. What is the purpose of decision diamonds in a flowchart?
Decision diamonds represent points in the program where a decision needs to be made based on a condition. They guide the flow of the program based on different outcomes.
5. How do I depict loops in a flowchart?
Loops are depicted using loop symbols that indicate a repetitive sequence of actions. These symbols direct the program back to a previous point until a condition is met.


